Examples
Define a graphic record “by hand”
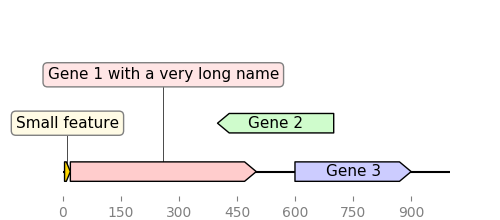
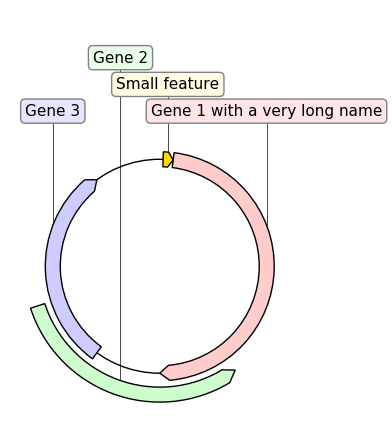
"""Simple example where a few features are defined "by hand" and are displayed
and exported as PNG, first with a linear view, then with a circular
view.
"""

from dna_features_viewer import (
    GraphicFeature,
    GraphicRecord,
    CircularGraphicRecord,
)

features = [
    GraphicFeature(
        start=5, end=20, strand=+1, color="#ffd700", label="Small feature"
    ),
    GraphicFeature(
        start=20,
        end=500,
        strand=+1,
        color="#ffcccc",
        label="Gene 1 with a very long name",
    ),
    GraphicFeature(
        start=400, end=700, strand=-1, color="#cffccc", label="Gene 2"
    ),
    GraphicFeature(
        start=600, end=900, strand=+1, color="#ccccff", label="Gene 3"
    ),
]


# PLOT AND EXPORT A LINEAR VIEW OF THE CONSTRUCT
record = GraphicRecord(sequence_length=1000, features=features)
ax, _ = record.plot(figure_width=5)
ax.figure.savefig("graphic_record_defined_by_hand.png")


# PLOT AND EXPORT A CIRCULAR VIEW OF THE CONSTRUCT
circular_rec = CircularGraphicRecord(sequence_length=1000, features=features)
ax2, _ = circular_rec.plot(figure_width=4)
ax2.figure.tight_layout()
ax2.figure.savefig(
    "graphic_record_defined_by_hand_circular.png", bbox_inches="tight"
)
Custom Biopython record translator
from dna_features_viewer import BiopythonTranslator
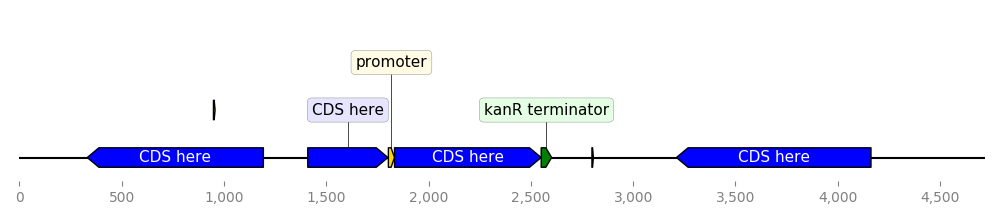
class MyCustomTranslator(BiopythonTranslator):
"""Custom translator implementing the following theme:
- Color terminators in green, CDS in blue, all other features in gold.
- Do not display features that are restriction sites unless they are BamHI
- Do not display labels for restriction sites.
- For CDS labels just write "CDS here" instead of the name of the gene.
"""
def compute_feature_color(self, feature):
if feature.type == "CDS":
return "blue"
elif feature.type == "terminator":
return "green"
else:
return "gold"
def compute_feature_label(self, feature):
if feature.type == 'restriction_site':
return None
elif feature.type == "CDS":
return "CDS here"
else:
return BiopythonTranslator.compute_feature_label(self, feature)
def compute_filtered_features(self, features):
"""Do not display promoters. Just because."""
return [
feature for feature in features
if (feature.type != "restriction_site")
or ("BamHI" in str(feature.qualifiers.get("label", '')))
]
graphic_record = MyCustomTranslator().translate_record("example_sequence.gb")
ax, _ = graphic_record.plot(figure_width=10)
ax.figure.tight_layout()
ax.figure.savefig("custom_biopython_translator.png")
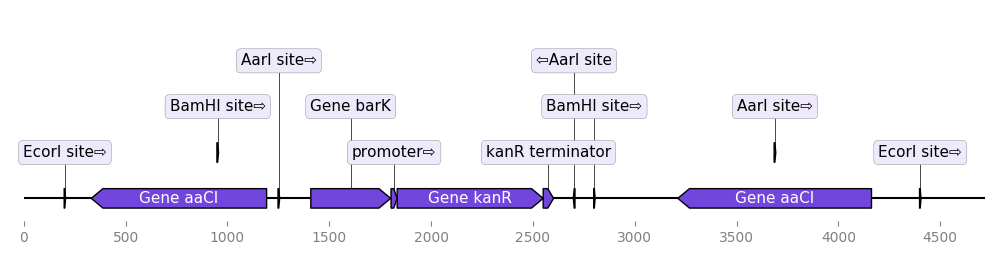
Load a graphic record from Genbank
from dna_features_viewer import BiopythonTranslator

graphic_record = BiopythonTranslator().translate_record("example_sequence.gb")
ax, _ = graphic_record.plot(figure_width=10, strand_in_label_threshold=7)
ax.figure.tight_layout()
ax.figure.savefig("from_genbank.png")
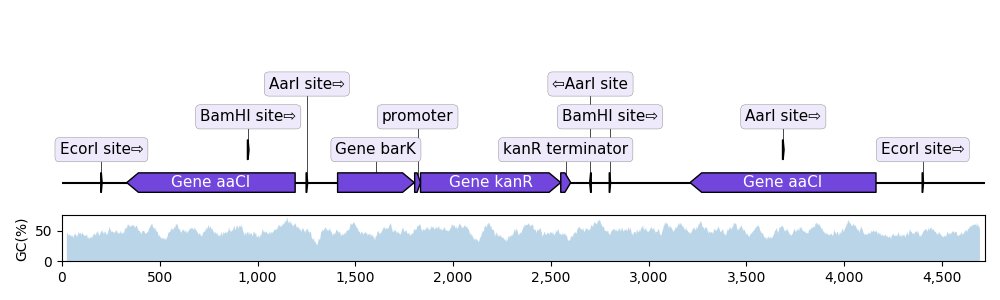
Plot sequence with GC content plot
"""In this example we plot a record's annotations on top of the curve of the
local GC content in the record's sequence.
"""
import matplotlib.pyplot as plt
from dna_features_viewer import BiopythonTranslator
from Bio import SeqIO
import numpy as np


def plot_local_gc_content(record, window_size, ax):
    """Plot windowed GC content on a designated Matplotlib ax."""
    def gc_content(s):
        return 100.0 * len([c for c in s if c in "GC"]) / len(s)

    yy = [
        gc_content(record.seq[i : i + window_size])
        for i in range(len(record.seq) - window_size)
    ]
    xx = np.arange(len(record.seq) - window_size) + 25
    ax.fill_between(xx, yy, alpha=0.3)
    ax.set_ylim(bottom=0)
    ax.set_ylabel("GC(%)")


record = SeqIO.read("example_sequence.gb", "genbank")
translator = BiopythonTranslator()
graphic_record = translator.translate_record(record)

fig, (ax1, ax2) = plt.subplots(
    2, 1, figsize=(10, 3), sharex=True, gridspec_kw={"height_ratios": [4, 1]}
)
graphic_record.plot(ax=ax1, with_ruler=False, strand_in_label_threshold=4)
plot_local_gc_content(record, window_size=50, ax=ax2)

fig.tight_layout()  # Resize the figure to the right height
fig.savefig("with_gc_plot.png")
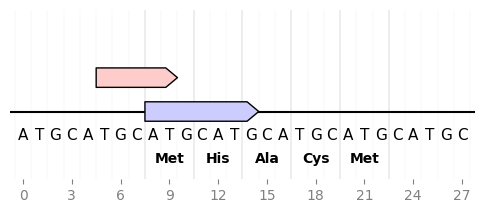
Sequence nucleotides and translation
from dna_features_viewer import GraphicFeature, GraphicRecord

record = GraphicRecord(sequence="ATGCATGCATGCATGCATGCATGCATGC", features=[
    GraphicFeature(start=5, end=10, strand=+1, color='#ffcccc'),
    GraphicFeature(start=8, end=15, strand=+1, color='#ccccff')
])

ax, _ = record.plot(figure_width=6)
record.plot_sequence(ax, guides_intensity=0.2)
fontdict = {'weight': 'bold'}
record.plot_translation(ax, (8, 23), fontdict=fontdict, guides_intensity=0.8)
ax.figure.savefig('sequence_and_translation.png', bbox_inches='tight')
Example with GIF
"""An example with GIF generation at the end. How cool is that!

This example requires the Moviepy library  installed (pip install moviepy).

"""
from Bio import Entrez, SeqIO
import moviepy.editor as mpe
from moviepy.video.io.bindings import mplfig_to_npimage
import matplotlib.pyplot as plt
from dna_features_viewer import BiopythonTranslator, CircularGraphicRecord

# DOWNLOAD THE PLASMID's RECORD FROM NCBI

handle = Entrez.efetch(
    db="nucleotide", id=1473096477, rettype="gb", retmode="text"
)
record = SeqIO.read(handle, "genbank")

# CREATE THE GRAPHIC RECORD WITH DNA_FEATURES_VIEWER

color_map = {
    "rep_origin": "yellow",
    "CDS": "orange",
    "regulatory": "red",
    "misc_recomb": "darkblue",
    "misc_feature": "lightblue",
}
translator = BiopythonTranslator(
    features_filters=(lambda f: f.type not in ["gene", "source"],),
    features_properties=lambda f: {"color": color_map.get(f.type, "white")},
)
translator.max_line_length = 15
graphic_record = translator.translate_record(
    record, record_class=CircularGraphicRecord
)
graphic_record.labels_spacing = 15

# ANIMATE INTO A GIF WITH MOVIEPY

duration = 5


def make_frame(t):
    top_nucleotide_index = t * graphic_record.sequence_length / duration
    graphic_record.top_position = top_nucleotide_index
    ax, _ = graphic_record.plot(figure_width=8, figure_height=11)
    ax.set_ylim(top=2)
    np_image = mplfig_to_npimage(ax.figure)
    plt.close(ax.figure)
    return np_image


clip = mpe.VideoClip(make_frame, duration=duration)
small_clip = clip.crop(x1=60, x2=-60, y1=100, y2=-100).resize(0.5)
small_clip.write_gif("example_with_gif.gif", fps=15)