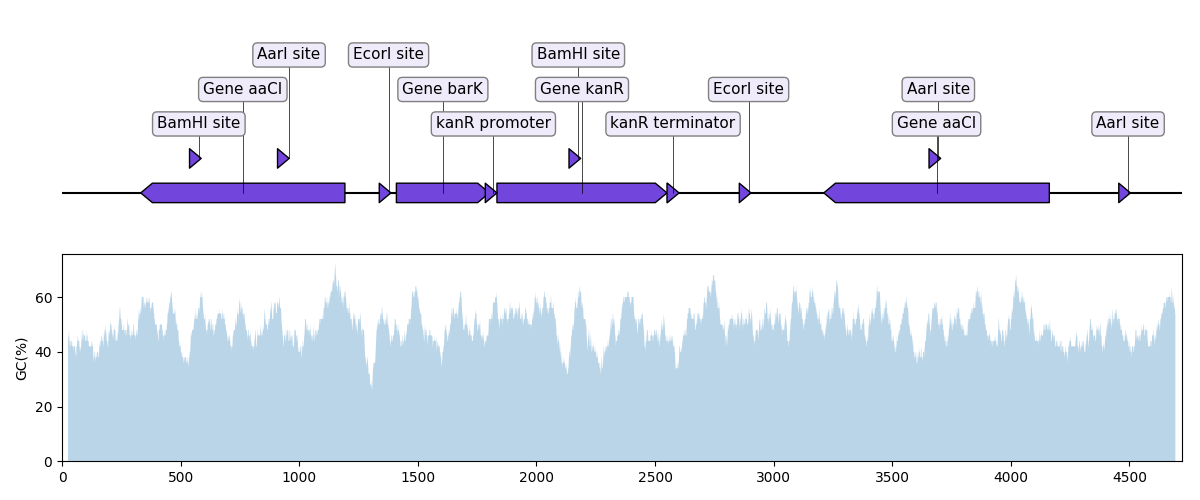
"""In this example we plot a record's annotations on top of the curve of the
local GC content in the record's sequence.
"""
import matplotlib.pyplot as plt
from dna_features_viewer import BiopythonTranslator
from Bio import SeqIO
import numpy as np


def plot_local_gc_content(record, window_size, ax):
    """Plot windowed GC content on a designated Matplotlib ax."""
    def gc_content(s):
        return 100.0 * len([c for c in s if c in "GC"]) / len(s)

    yy = [
        gc_content(record.seq[i : i + window_size])
        for i in range(len(record.seq) - window_size)
    ]
    xx = np.arange(len(record.seq) - window_size) + 25
    ax.fill_between(xx, yy, alpha=0.3)
    ax.set_ylim(bottom=0)
    ax.set_ylabel("GC(%)")


record = SeqIO.read("example_sequence.gb", "genbank")
translator = BiopythonTranslator()
graphic_record = translator.translate_record(record)

fig, (ax1, ax2) = plt.subplots(2, 1, figsize=(12, 5), sharex=True)
ax, levels = graphic_record.plot()
graphic_record.plot(ax=ax1, with_ruler=False)
plot_local_gc_content(record, window_size=50, ax=ax2)

fig.tight_layout()  # Resize the figure to the right height
fig.savefig("with_gc_plot.png")
